The 4 types of data in statistics—nominal, ordinal, discrete, and continuous— form the foundation of statistics and data analysis. Understanding these types of data in statistics helps researchers, analysts, and students make accurate decisions. In statistics, data is categorized into specific types based on its characteristics and usage. These four main data types are essential for organizing, analyzing, and interpreting information effectively. Each type serves a different purpose and requires different methods of analysis. Learning the nominal, ordinal, discrete, and continuous data types improves your statistical knowledge and helps you work efficiently with real-world data in business, science, and technology.
What is Data in Statistics?
In statistics, data refers to a collection of facts, numbers, observations, or measurements gathered for analysis. It can be qualitative (descriptive) or quantitative (numerical). Data is used to identify patterns, test hypotheses, and support decision-making. For example, survey responses, temperature readings, and exam scores are all forms of data. Without proper classification, data can become confusing and difficult to interpret. That’s why understanding its structure and type is crucial. Properly categorized data allows analysts to apply the right statistical tools and extract meaningful insights efficiently.
Why Understanding Data Types is Important
Knowing the type of data you are working with is critical for accurate analysis. Different data types require different statistical methods, graphs, and interpretations. For example, you cannot calculate an average for nominal data, but you can for continuous data. Misclassifying data can lead to incorrect conclusions and poor decisions. Understanding data types also helps in choosing the right data visualization techniques like bar charts, histograms, or pie charts. Whether you are a student or a data professional, mastering data types ensures better accuracy, efficiency, and clarity in your work.
Overview of the 4 Types of Data
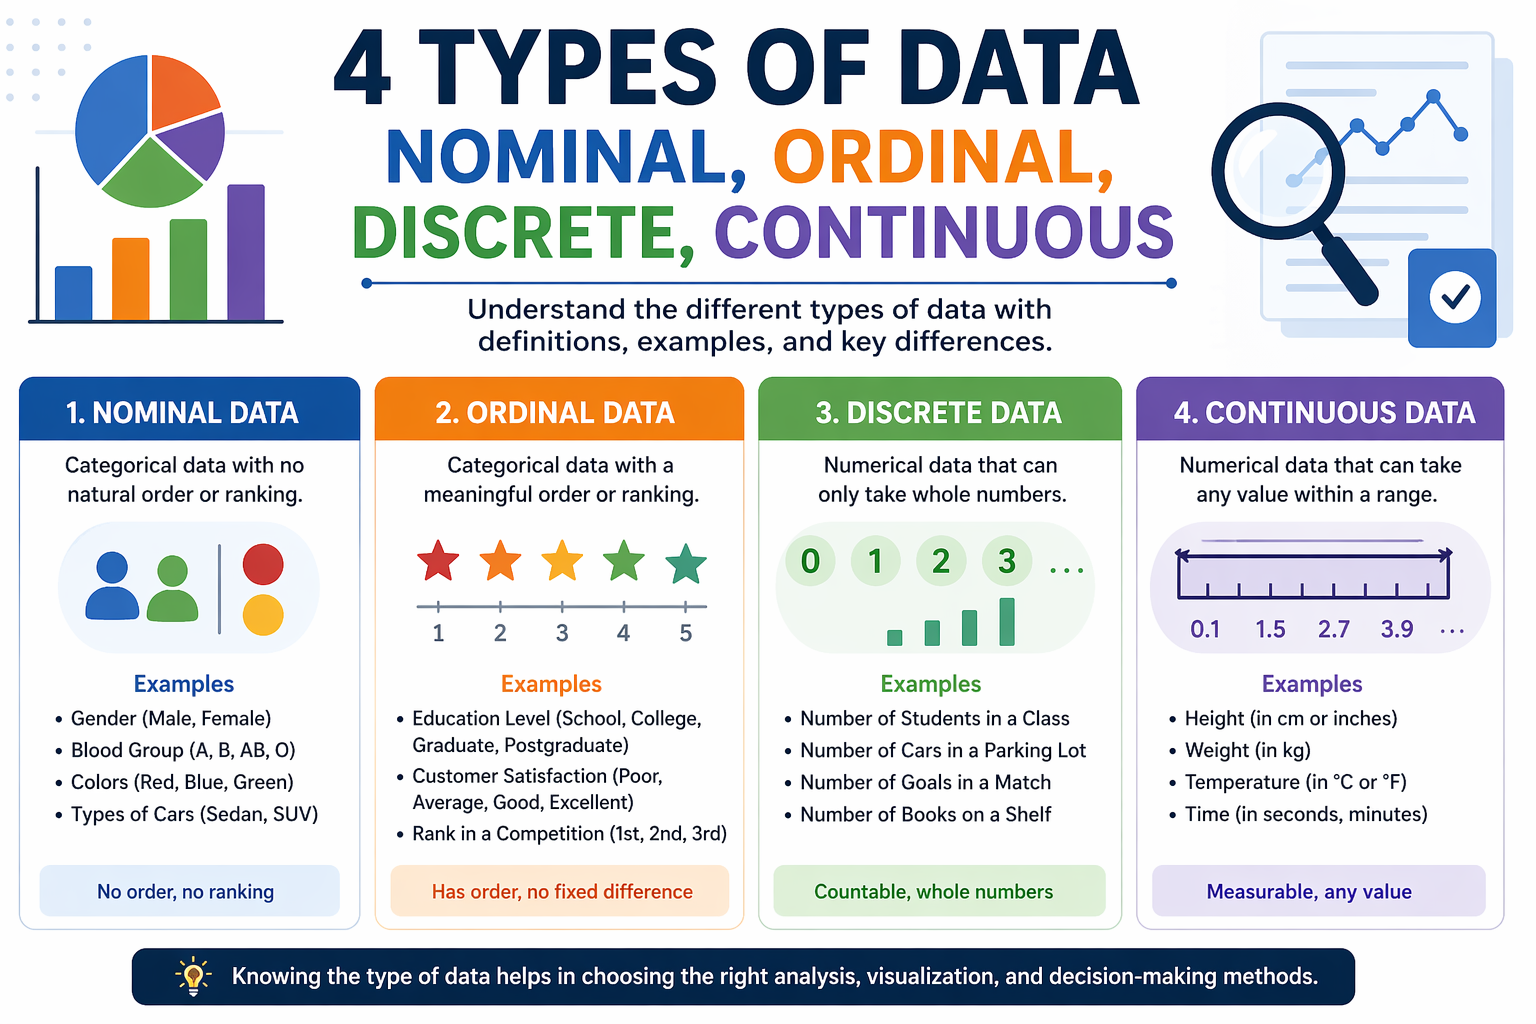
The four main types of data are nominal, ordinal, discrete, and continuous. Nominal data represents categories without order, such as gender or colors. Ordinal data shows ordered categories, like rankings or satisfaction levels. Discrete data consists of countable values, such as the number of students. Continuous data includes measurable values that can take any range, like height or weight. These classifications fall under qualitative and quantitative data types. Understanding these four types provides a strong foundation for statistical analysis and helps you choose the right approach for handling data.
Also Read: 4 Types of Data – Nominal, Ordinal, Discrete, Continuous
What is Nominal Data? (Definition & Examples)
Nominal data is a type of qualitative data that represents categories or labels without any specific order or ranking. Each category is unique and cannot be compared numerically. For example, gender (male, female), blood group (A, B, AB, O), and colors (red, blue, green) are all nominal data. These values are simply names or labels and do not carry any quantitative meaning. Nominal data is commonly used in surveys and classification tasks. It is usually analyzed using frequency counts or percentages rather than mathematical calculations.
Key Characteristics of Nominal Data
Nominal data has several unique features that distinguish it from other data types. First, it is purely categorical, meaning values represent names or labels. Second, there is no logical order or ranking between categories. Third, mathematical operations like addition or averaging cannot be applied. Fourth, it is often represented using bar charts or pie charts for visualization. Lastly, each category is mutually exclusive, meaning one data point can belong to only one category. These characteristics make nominal data simple to understand but limited in terms of statistical analysis.
Real-Life Examples of Nominal Data
Nominal data is widely used in everyday life and various industries. Examples include types of vehicles (car, bike, truck), countries (India, USA, UK), and languages (English, Hindi, Spanish). In healthcare, patient blood groups are nominal data. In marketing, customer preferences like favorite brands are also nominal. Even social media categories such as post types (image, video, text) fall under nominal data. These examples show how nominal data helps in classification and grouping but does not provide measurable or ordered information.
What is Ordinal Data? (Definition & Examples)
Ordinal data is a type of qualitative data that involves categories with a meaningful order or ranking. Unlike nominal data, ordinal data shows the relative position of values, but the differences between them are not measurable. For example, rankings like first, second, and third place, or satisfaction levels such as poor, average, and excellent. While ordinal data indicates order, it does not tell how much one value differs from another. This makes it useful for surveys, feedback forms, and performance evaluations.
Key Features of Ordinal Data
Ordinal data has distinct characteristics that make it different from nominal and quantitative data. First, it includes categories that can be ranked or ordered. Second, the intervals between categories are not equal or defined. Third, arithmetic operations are limited and not meaningful. Fourth, it is often visualized using bar charts or ordered graphs. Lastly, ordinal data is commonly used in surveys and questionnaires to measure opinions or preferences. These features make it ideal for analyzing relative comparisons rather than exact values.
Real-World Examples of Ordinal Data
Ordinal data is commonly seen in real-world scenarios where ranking or order matters. Examples include education levels (high school, bachelor’s, master’s), customer satisfaction ratings (low, medium, high), and movie ratings (1 star to 5 stars). In competitions, positions like gold, silver, and bronze medals are ordinal. Employee performance levels and survey responses also fall under this category. These examples show how ordinal data helps in understanding preferences, priorities, and rankings without measuring exact differences.
What is Discrete Data? (Definition & Examples)
Discrete data is a type of quantitative data that consists of countable and distinct values. These values are usually whole numbers and cannot be divided into smaller parts. For example, the number of students in a class, the number of cars in a parking lot, or the number of goals scored in a match. Discrete data is often obtained through counting rather than measuring. It is widely used in mathematics, statistics, and real-life scenarios where exact counts are needed.
Characteristics of Discrete Data
Discrete data has specific characteristics that make it easy to identify. First, it consists of countable values. Second, it usually includes whole numbers with no decimals. Third, there are gaps between values, meaning intermediate values are not possible. Fourth, it is often represented using bar charts or frequency tables. Lastly, discrete data is commonly used in counting-based scenarios such as population size or number of items sold. These features make it suitable for simple statistical analysis and clear interpretation.
Examples of Discrete Data in Daily Life
Discrete data appears frequently in daily life and practical situations. Examples include the number of children in a family, the number of books on a shelf, and the number of customers visiting a store. In sports, scores and goals are discrete data. In business, sales units and inventory counts are also discrete. Even counting steps in a day using a fitness tracker falls under this category. These examples highlight how discrete data helps in tracking quantities and making decisions based on exact counts.
What is Continuous Data? (Definition & Examples)
Continuous data is a type of quantitative data that can take any value within a given range. Unlike discrete data, it is measurable and can include fractions or decimals. Examples include height, weight, temperature, and time. Continuous data is often collected through measurement rather than counting. It provides more precise information and is widely used in scientific research, engineering, and analytics. Because it can take infinite values within a range, continuous data is ideal for detailed statistical analysis and predictions.
Key Characteristics of Continuous Data
Continuous data has unique features that distinguish it from other types. First, it can take any value within a range, including decimals. Second, it is measured rather than counted. Third, there are no gaps between values, meaning intermediate values are possible. Fourth, it supports advanced mathematical operations like mean and standard deviation. Lastly, continuous data is often visualized using histograms or line graphs. These characteristics make it highly valuable for accurate and detailed analysis.
Real-Life Examples of Continuous Data
Continuous data is used in many real-life situations. Examples include measuring a person’s height or weight, recording temperature changes, and tracking time taken to complete a task. In healthcare, blood pressure and heart rate are continuous data. In finance, stock prices also vary continuously. Even distance traveled and speed are examples. These cases show how continuous data helps in precise measurement and analysis, making it essential in scientific and technical fields.
Difference Between Nominal and Ordinal Data
Nominal and ordinal data are both qualitative, but they differ in key ways. Nominal data has no order or ranking, while ordinal data has a clear sequence. For example, colors are nominal, but rankings like first or second are ordinal. Nominal data cannot be compared, whereas ordinal data allows relative comparison. However, neither type supports meaningful arithmetic operations. Understanding this difference helps in choosing the right analysis method and avoiding confusion in data classification.
Difference Between Discrete and Continuous Data
Discrete and continuous data are both quantitative but differ significantly. Discrete data is countable and consists of whole numbers, while continuous data is measurable and can include decimals. For example, the number of students is discrete, but their height is continuous. Discrete data has gaps between values, whereas continuous data does not. Continuous data allows more precise analysis, while discrete data is simpler to collect and interpret. Knowing this distinction is crucial for accurate statistical analysis.
Comparison Table of All 4 Data Types
| Data Type | Nature | Example | Can Be Measured | Can Be Ordered |
| Nominal | Qualitative | Gender, Colors | No | No |
| Ordinal | Qualitative | Rankings, Ratings | No | Yes |
| Discrete | Quantitative | Number of Students | No (Countable) | Yes |
| Continuous | Quantitative | Height, Temperature | Yes | Yes |
This comparison makes it easier to quickly identify and differentiate between the four types of data.
How to Identify Different Types of Data
To identify data types, start by asking simple questions. Is the data categorical or numerical? If it’s categorical without order, it’s nominal. If it has an order, it’s ordinal. If the data is numerical, check whether it is countable or measurable. Countable values indicate discrete data, while measurable values indicate continuous data. This step-by-step approach helps in correctly classifying data and ensures accurate analysis in statistics and research.
Common Mistakes When Classifying Data
Many people confuse data types due to similar characteristics. One common mistake is treating ordinal data as numerical and performing calculations like averages. Another error is confusing discrete and continuous data, especially when dealing with numbers. Misclassification can lead to incorrect analysis and misleading results. It’s important to understand the definitions and characteristics clearly. Always verify whether the data is countable, measurable, or categorical before assigning a type.
Applications of Data Types in Real Life
Data types are widely used across industries. In business, companies use nominal data for customer segmentation and ordinal data for satisfaction surveys. In healthcare, continuous data like blood pressure helps in diagnosis. In education, discrete data is used to count students and grades. Data types also play a crucial role in machine learning, research, and decision-making. Understanding these applications helps you see how data classification impacts real-world outcomes.
Importance of Data Types in Data Analysis
Data types are essential for choosing the right statistical methods. They determine how data is collected, analyzed, and visualized. For example, continuous data can be used for advanced analysis like regression, while nominal data is used for classification. Using the wrong method can lead to incorrect insights. Proper understanding of data types ensures accurate results, better decision-making, and effective communication of findings. It forms the backbone of all statistical and analytical processes.
Tips to Remember the 4 Types of Data Easily
A simple way to remember data types is through a quick trick:
- Nominal = Name (no order)
- Ordinal = Order (ranking exists)
- Discrete = Count (whole numbers)
- Continuous = Measure (decimals possible)
You can also group them as qualitative (nominal, ordinal) and quantitative (discrete, continuous). Using mnemonics and real-life examples makes it easier to recall during exams or practical use. Regular practice and application further strengthen your understanding.
Conclusion:
Understanding the four types of data—nominal, ordinal, discrete, and continuous—is essential for anyone working with statistics or data analysis. Each type has unique characteristics and applications. Proper classification ensures accurate analysis and meaningful insights. Whether you are a student, researcher, or professional, mastering data types will improve your analytical skills and decision-making ability. By learning these concepts, you build a strong foundation for advanced statistical techniques and real-world data applications.
Also Read: Master’s in Data Science: